
Unlock more grid capacity with
local real-time weather data.
Unlock More Grid Capacity with Local Weather Data.
Unlock more grid capacity with
local real-time weather data.
Leading overhead line sensor provides in-depth real-time data. Deployed in 8+ countries. With up to 40% increase in capacity using local weather data.
Leading overhead line sensor provides in-depth real-time data. Deployed in 8+ countries. With up to 40% increase in capacity using local weather data.
Reliable Real-time Data
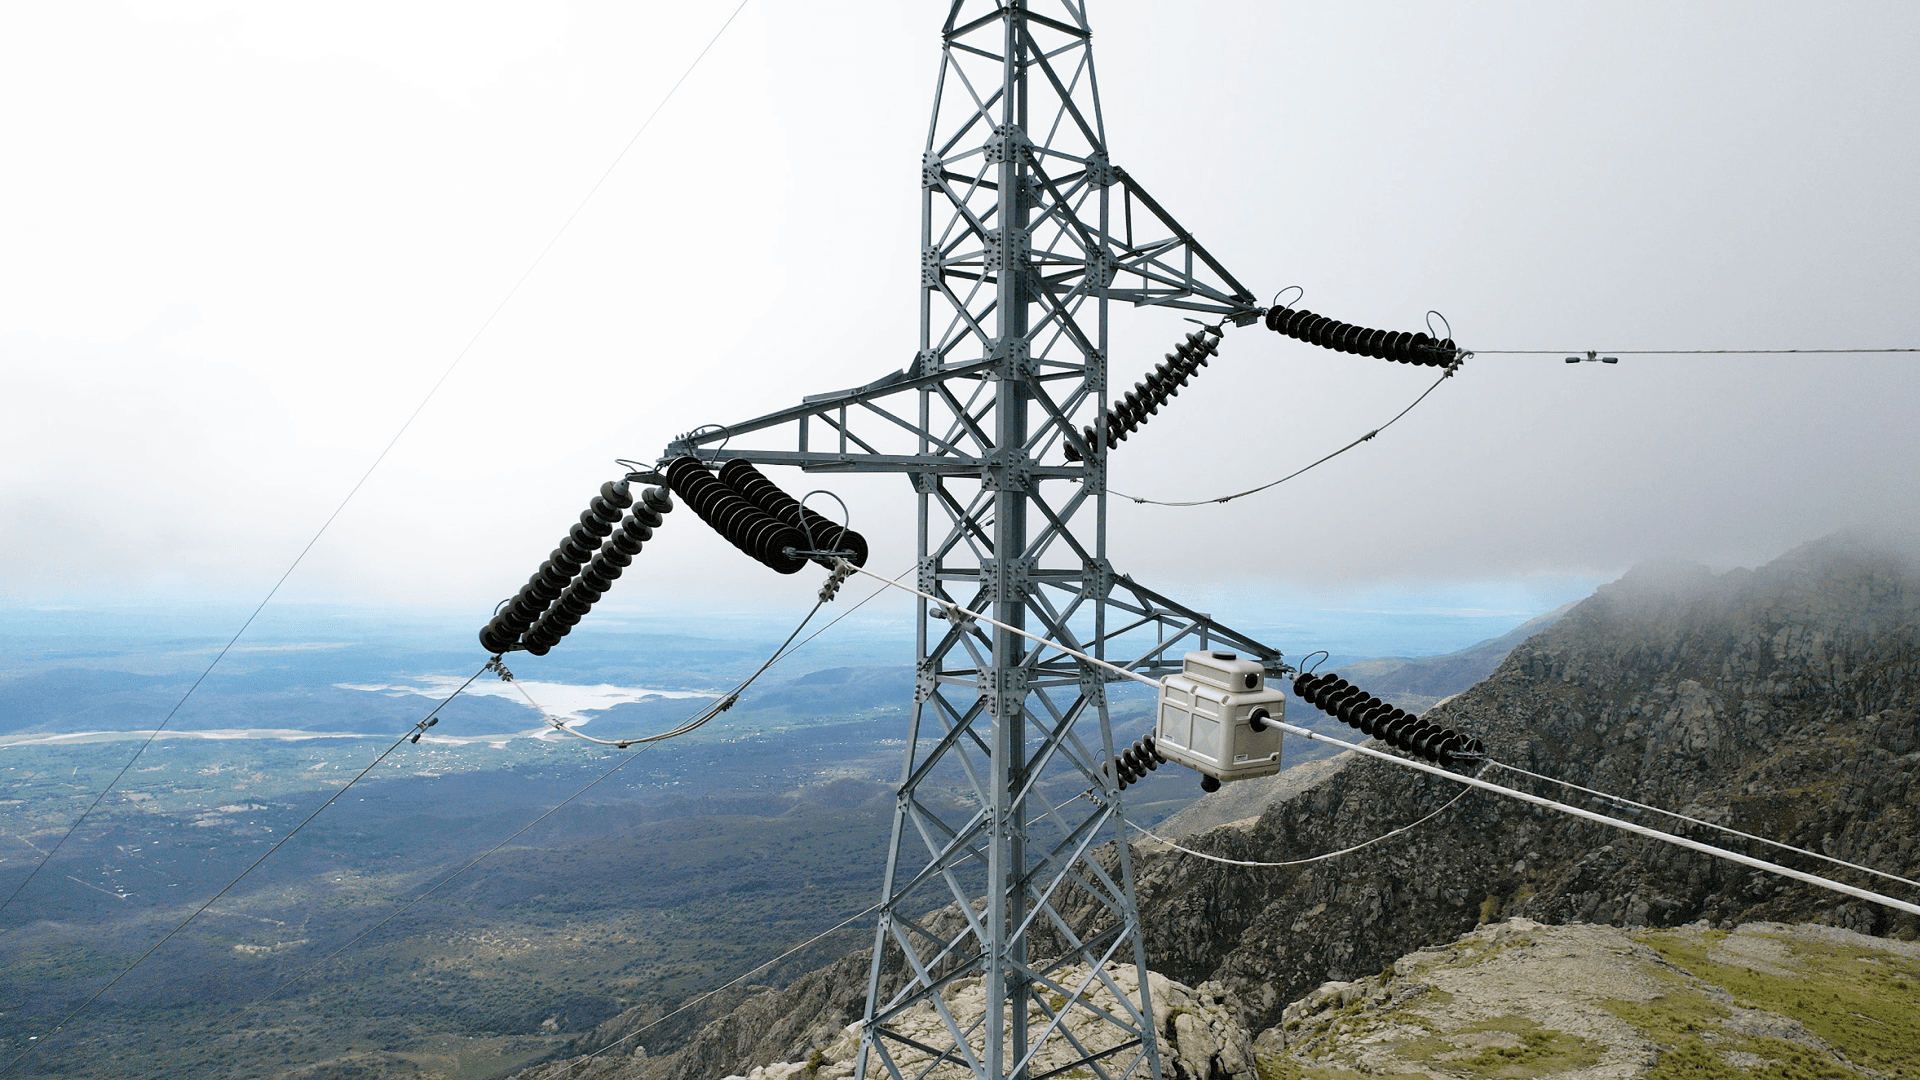
The LKX-MULTI measures key line and weather parameters.
Wind Speed & Direction
Our systems measure wind speed and direction directly from the conductor.
Industry Compliance
Our system comply with international standards and FERC Order No. 881.
Easy Installation
Once installed via bucket truck our systems start streaming data instantly.
Struggling to maximize grid capacity and meet growing energy demands? Unlock up to 40% more capacity without expensive upgrades—using real-time local weather data.
Struggling to maximize grid capacity and meet growing energy demands? Unlock up to 40% more capacity without expensive upgrades—using real-time local weather data.
Step by Step
Unlock Full Grid Potential in 4 Easy Steps
Our simple, streamlined process guides you from assessment to optimized grid capacity, ensuring maximum efficiency and compliance with minimal effort.
Step by Step
Unlock Full Grid Potential in 4 Easy Steps
Our simple, streamlined process guides you from assessment to optimized grid capacity, ensuring maximum efficiency and compliance with minimal effort.
Step by Step
Unlock Full Grid Potential in 4 Easy Steps
Our simple, streamlined process guides you from assessment to optimized grid capacity, ensuring maximum efficiency and compliance with minimal effort.
1. Grid Assessment

We start with a detailed analysis of your power lines to determine the optimal number of sensors.
2. Installation
Our LKX-MULTI sensors are installed quickly, and they begin streaming real-time data immediately after installation.
3. Monitor Data
Track critical factors like wind, temperature, and line current in real-time.
4. Optimize Capacity
Leverage real-time data to increase your grid’s capacity by up to 40% while maintaining safety standards.
Assess Your Grid for Optimal Coverage
Our team conducts an in-depth evaluation of your grid, considering factors like line length, environmental conditions, and transmission load. This allows us to tailor a sensor deployment strategy that ensures comprehensive data collection and grid optimization, maximizing capacity with minimal cost.

1. Grid Assessment

We start with a detailed analysis of your power lines to determine the optimal number of sensors.
2. Installation
Our LKX-MULTI sensors are installed quickly, and they begin streaming real-time data immediately after installation.
3. Monitor Data
Track critical factors like wind, temperature, and line current in real-time.
4. Optimize Capacity
Leverage real-time data to increase your grid’s capacity by up to 40% while maintaining safety standards.
1. Grid Assessment
We start with a detailed analysis of your power lines to determine the optimal number of sensors.
2. Installation
Our LKX-MULTI sensors are installed quickly, and they begin streaming real-time data immediately after installation.
3. Monitor Data
Track critical factors like wind, temperature, and line current in real-time.
4. Optimize Capacity
Leverage real-time data to increase your grid’s capacity by up to 40% while maintaining safety standards.
Assess Your Grid for Optimal Coverage
Our team conducts an in-depth evaluation of your grid, considering factors like line length, environmental conditions, and transmission load. This allows us to tailor a sensor deployment strategy that ensures comprehensive data collection and grid optimization, maximizing capacity with minimal cost.
5 Key Criteria
How Many Sensors Do You Need?
How Many Sensors Do You Need?
How Many Sensors Do You Need?
Don't worry, our expert team guides you step by step to ensure your grid is fully covered. Here are five criteria we use to determine the number of sensors needed.
Don't worry, our expert team guides you step by step to ensure your grid is fully covered. Here are five criteria we use to determine the number of sensors needed.
Don't worry, our expert team guides you step by step to ensure your grid is fully covered. Here are five criteria we use to determine the number of sensors needed.

Intuitive User Interface for Effortless Navigation
Intuitive User Interface for Effortless Navigation

Real-time reports on ampacity.
Real-time reports on ampacity.

Advanced analytics for data-driven decision-making.
Advanced analytics for data-driven decision-making.

Robust Data Security Measures
Robust Data Security Measures
Is the terrain mountainous or flat?
Is the terrain mountainous or flat?
Is the terrain mountainous or flat?
Terrain can impact clearance, so sensors should be placed at critical points where low clearance or varying terrain could affect line safety and performance.
Terrain can impact clearance, so sensors should be placed at critical points where low clearance or varying terrain could affect line safety and performance.
Terrain can impact clearance, so sensors should be placed at critical points where low clearance or varying terrain could affect line safety and performance.
Are there different conductor sections?
Are there different conductor sections?
Are there different conductor sections?
Ensure each conductor section, especially limiting ones, has at least one sensor to monitor performance.
Ensure each conductor section, especially limiting ones, has at least one sensor to monitor performance.
Ensure each conductor section, especially limiting ones, has at least one sensor to monitor performance.
Is wind significant in certain areas?
Is wind significant in certain areas?
Is wind significant in certain areas?
Position sensors where wind significantly affects line cooling, with fewer sensors on straighter sections.
Position sensors where wind significantly affects line cooling, with fewer sensors on straighter sections.
Position sensors where wind significantly affects line cooling, with fewer sensors on straighter sections.
Does temperature vary along the line?
Does temperature vary along the line?
Does temperature vary along the line?
Since temperature variations are minimal over shorter distances, it’s sufficient to place sensors approximately every 10 km to monitor these changes.
Since temperature variations are minimal over shorter distances, it’s sufficient to place sensors approximately every 10 km to monitor these changes.
Since temperature variations are minimal over shorter distances, it’s sufficient to place sensors approximately every 10 km to monitor these changes.
Are your power lines in wildfire-prone areas?
Are your power lines in wildfire-prone areas?
Are your power lines in wildfire-prone areas?
Utilities often place sensors for other reasons beyond DLR.
Utilities often place sensors for other reasons beyond DLR.
Utilities often place sensors for other reasons beyond DLR.
Why Laki Power
Precision You Can Trust
Laki Power’s direct sensor measurements offer up more accurate line ratings compared to weather API estimates, ensuring safe and optimal grid performance.
Laki Power Sensor
Laki Power Sensors
Weather models rely on data from distant weather stations, which can be far from the transmission line, leading to less accurate estimates of local conditions.
More Capacity: Up to 23% more increase in capacity compared to weather models.
Prevent Overheating using local sensors that measure ground clearance and conductor temperature.
Local weather data: measured directly from the conductor ensures accurate data and less errors.
Real-time monitoring of current helps operators make capacity adjustments.
Weather Models
Weather models rely on data from distant weather stations, which can be far from the transmission line, leading to less accurate estimates of local conditions.
Less capacity increase due to weather discrepancies
Potential Overheating when overestimating wind conditions can lead to line damage.
Estimated weather data leading to less precise data and potential errors.
Not in real-time: APIs don't measure line current, limiting accurate capacity adjustments.
LKX-MULTI
LKX-MULTI
Line powered monitoring unit.

Autonomous
Autonomous
Autonomous
Local Weather
Local Weather
Local Weather
LTE / Satellite
LTE / Satellite
LTE / Satellite
Technology
Explore the Future of Grid Optimization
Explore the Future of Grid Optimization
Explore the Future of Grid Optimization
At Laki Power, we help utilities worldwide optimize grid capacity and meet compliance standards. Our advanced LKX-MULTI sensor provides real-time data to help you unlock the full potential of your power lines.
At Laki Power, we help utilities worldwide optimize grid capacity and meet compliance standards. Our advanced LKX-MULTI sensor provides real-time data to help you unlock the full potential of your power lines.
Local Weather Data: We capture real-time weather conditions directly from the conductor, providing highly accurate data that adapts to changing environmental factors for optimized grid capacity.
Line Sensors: Our sensors measure critical parameters such as ground clearance, line temperature, and line current, offering precise, real-time insights to ensure the safety and efficiency of your power lines.
Intelligent Forecasting: By combining localized data from our sensors with external forecasts, our system delivers unmatched accuracy, allowing you to plan and optimize grid performance with greater precision.
8+
8+
Countries Deployed
Countries Deployed
Countries Deployed
40%
40%
Increase in Capacity
Increase in Capacity
Increase in Capacity
10+
10+
Local Sensors
Local Sensors
Local Sensors
Localized Data we Collect
Comprehensive Real-Time Monitoring for Optimal Grid Performance
Our advanced sensors continuously monitor critical environmental and line-specific parameters like wind speed, temperature, and line current, providing the real-time data needed to ensure safe and efficient grid operations.
Wind Speed
Wind speed is critical for cooling the conductor, with favorable conditions accounting for up to 80% of increased line capacity through enhanced heat dissipation.
Wind speed is critical for cooling the conductor, with favorable conditions accounting for up to 80% of increased line capacity through enhanced heat dissipation.
Wind speed is critical for cooling the conductor, with favorable conditions accounting for up to 80% of increased line capacity through enhanced heat dissipation.
Wind Direction
Wind Direction
Wind Direction
The direction of the wind affects how efficiently conductors are cooled, with favorable winds optimizing cooling and boosting line performance.
The direction of the wind affects how efficiently conductors are cooled, with favorable winds optimizing cooling and boosting line performance.
The direction of the wind affects how efficiently conductors are cooled, with favorable winds optimizing cooling and boosting line performance.
Ambient Temperature
Ambient Temperature
Ambient Temperature
Monitoring ambient temperature is critical, as it impacts the cooling efficiency of conductors, which directly affects their ability to carry more or less current.
Monitoring ambient temperature is critical, as it impacts the cooling efficiency of conductors, which directly affects their ability to carry more or less current.
Monitoring ambient temperature is critical, as it impacts the cooling efficiency of conductors, which directly affects their ability to carry more or less current.
Ground Clearance
Ground Clearance
Ground Clearance
Monitoring ambient temperature is critical, as it impacts the cooling efficiency of conductors, which directly affects their ability to carry more or less current.
Monitoring ambient temperature is critical, as it impacts the cooling efficiency of conductors, which directly affects their ability to carry more or less current.
Monitoring ambient temperature is critical, as it impacts the cooling efficiency of conductors, which directly affects their ability to carry more or less current.
Line Current
Line Current
Line Current
Real-time monitoring of line current provides insights into the electrical load, which helps optimize capacity while maintaining safe operation.
Real-time monitoring of line current provides insights into the electrical load, which helps optimize capacity while maintaining safe operation.
Real-time monitoring of line current provides insights into the electrical load, which helps optimize capacity while maintaining safe operation.
Line Temperature
Line Temperature
Line Temperature
By continuously measuring the conductor temperature, we ensure the system operates within safe thermal limits and prevent overheating.
By continuously measuring the conductor temperature, we ensure the system operates within safe thermal limits and prevent overheating.
By continuously measuring the conductor temperature, we ensure the system operates within safe thermal limits and prevent overheating.

Deployed in 8 countries
Our Trusted Partnerships
Our Trusted Partnerships
Discover our network of trusted partners, collaborating to enhance SAP's capabilities and deliver exceptional value to clients.
Discover our network of trusted partners, collaborating to enhance SAP's capabilities and deliver exceptional value to clients.
Discover our network of trusted partners, collaborating to enhance SAP's capabilities and deliver exceptional value to clients.
Our Blogs
Explore Our DLR Articles
Dive deeper into the latest research, analysis, and innovations in Dynamic Line Rating technology.
Our Blogs
Explore Our DLR Articles
Dive deeper into the latest research, analysis, and innovations in Dynamic Line Rating technology.
Our Blogs
Explore Our DLR Articles
Dive deeper into the latest research, analysis, and innovations in Dynamic Line Rating technology.
Our Blogs
Explore Our DLR Articles
Dive deeper into the latest research, analysis, and innovations in Dynamic Line Rating technology.


FAQ's
Frequently Asked Questions
Find answers to commonly asked questions about our DLR solution to help you make informed decisions for your grid needs.
What is Dynamic Line Rating?
How does DLR differ from Static Line Rating (SLR)?
Why is wind speed so important for DLR?
How many sensors do I need for DLR?
Is DLR compliant with FERC regulations?
What is the installation process for DLR sensors?
Can DLR help reduce operational costs?
How accurate is the forecasting with DLR?
What kind of data do DLR sensors measure?
What other benefits does the LKX-MULTI offer?
Download Feasability Study
Discover how implementing a Dynamic Thermal Line Rating (DTLR) system can enhance power line capacity and increase revenues, based on our in-depth feasibility study for a 380kV line
39.9%
Capacity Increase
$75M
Extra Revenue
Download Feasability Study
Discover how implementing a Dynamic Thermal Line Rating (DTLR) system can enhance power line capacity and increase revenues, based on our in-depth feasibility study for a 380kV line
39.9%
Capacity Increase
$75M
Extra Revenue
Download Feasability Study
Discover how implementing a Dynamic Thermal Line Rating (DTLR) system can enhance power line capacity and increase revenues, based on our in-depth feasibility study for a 380kV line
39.9%
Capacity Increase
$75M
Extra Revenue
Download Feasability Study
Discover how implementing a Dynamic Thermal Line Rating (DTLR) system can enhance power line capacity and increase revenues, based on our in-depth feasibility study for a 380kV line
39.9%
Capacity Increase
$75M
Extra Revenue